
Note: you must be a Patron Member to be able to use HUD Stats, see this F.A.Q. to see how to upgrade your account to Patron.
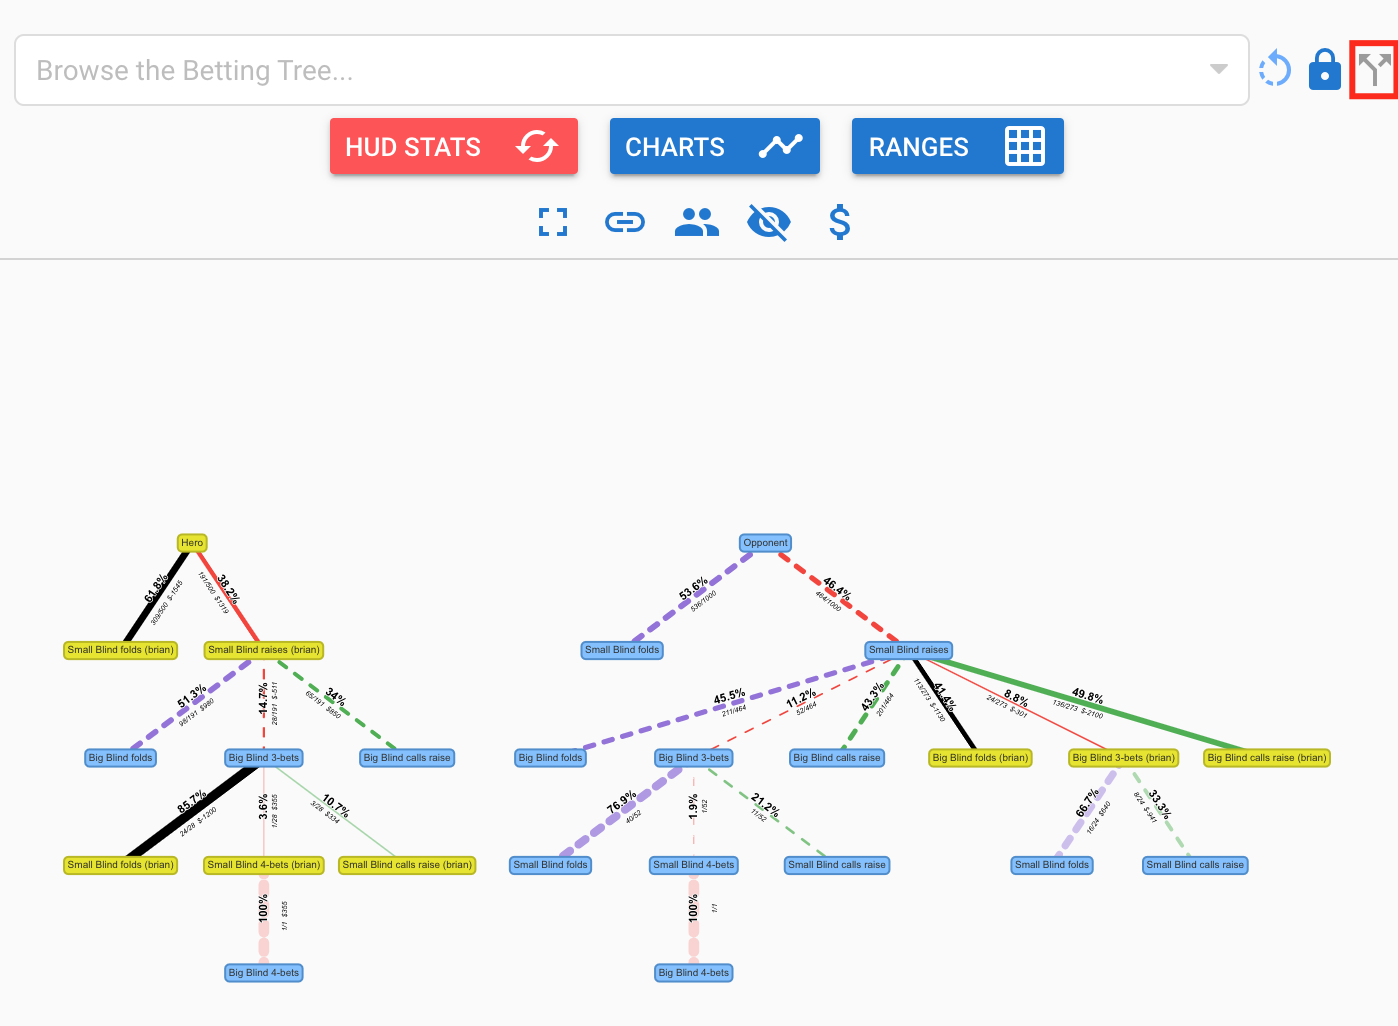
Game Tree Analysis allows you to see in what lines you are losing money and if any of your frequencies are exploitable, for example this was a heads up match where Hero on the button opened 93.6% , Villian 3-bet 23.1% , and Hero folded 70.4% indicating a leak:
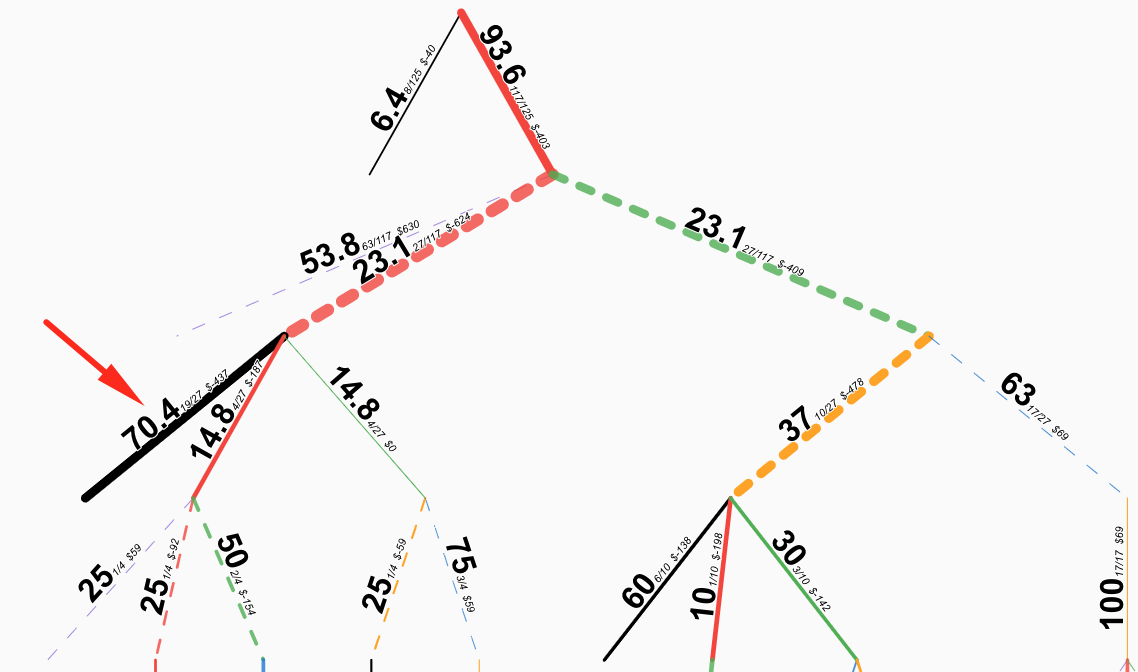
Note that in a Game Tree, the width of the branch corresponds to the frequency that line was taken. So the more a line was taken, the thicker the branch will be.
Dotted lines indicate an opponents actions, Solid lines indicate Hero’s actions.
Further, the colors correspond to the following actions:
Red means Raise, Orange means Bet, Green means Call, Blue means Check, Black means Fold .
To Use Game Tree Analysis:
-
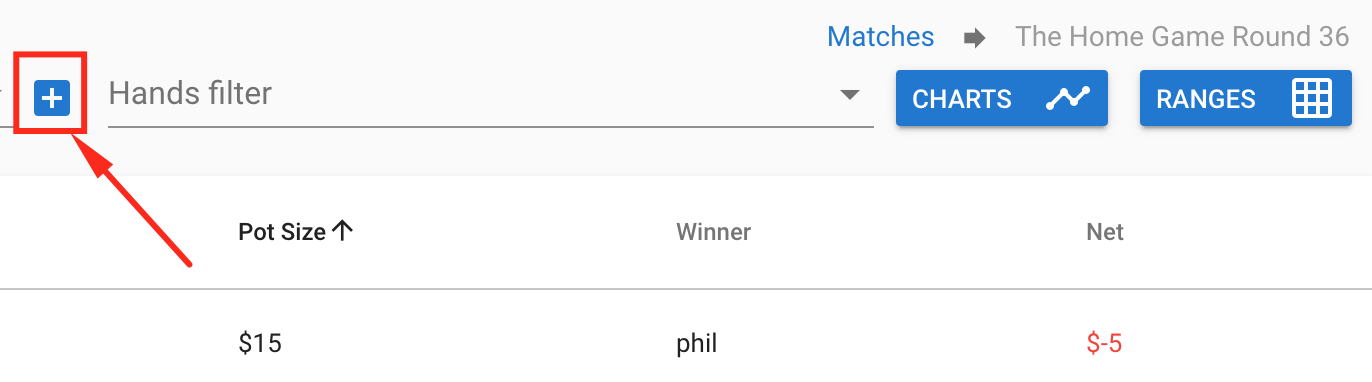
Go to Matches -> (Select any match) -> Hands
-
Click the
 Icon shown below:
-
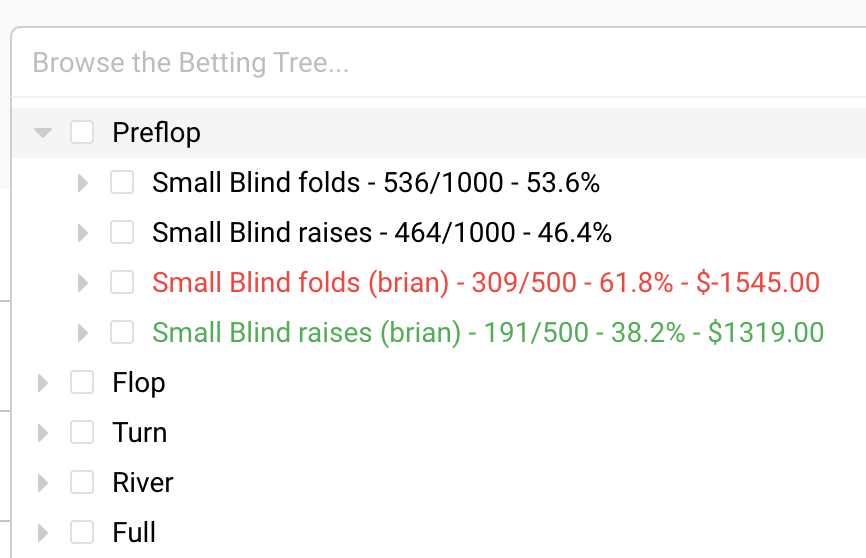
At this point you can browse the betting tree using the drop down:
-
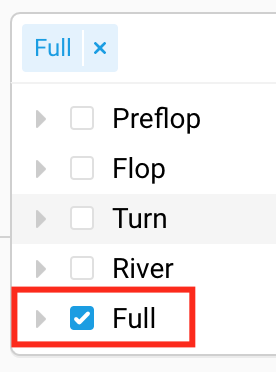
If you want to visualize the tree, I normally prefer to analyze the Full Game Tree at once by selecting Full:
-
Next hit the
 icon to see the Game Tree:
-
You can select any node in the Tree to see Hands below that correspond to that level of the tree:
-
If you prefer a less noisy Game Tree, you can select the
 icon to get rid of labels, and the
  icon if you want to change branch widths to represent money won/loss instead of frequency taken:

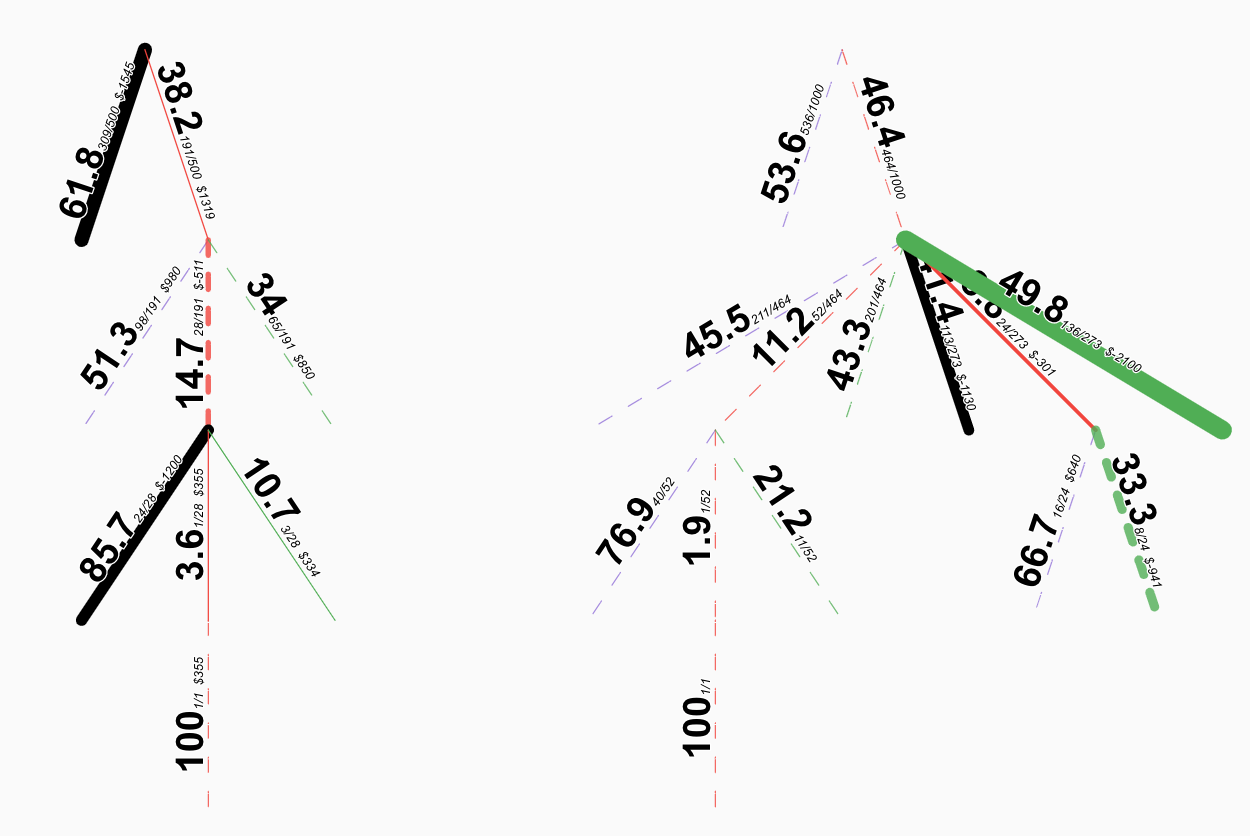
In a heads up match, the left tree is Hero’s button, the right tree is Villian’s button.
Now we can quickly visualize that Hero lost the most money by folding too many buttons and also lost money when Villian opened button and Hero called.